Understanding Hyper-V CPU Usage (Physical and Virtual)
by


Etienne Liebetrau
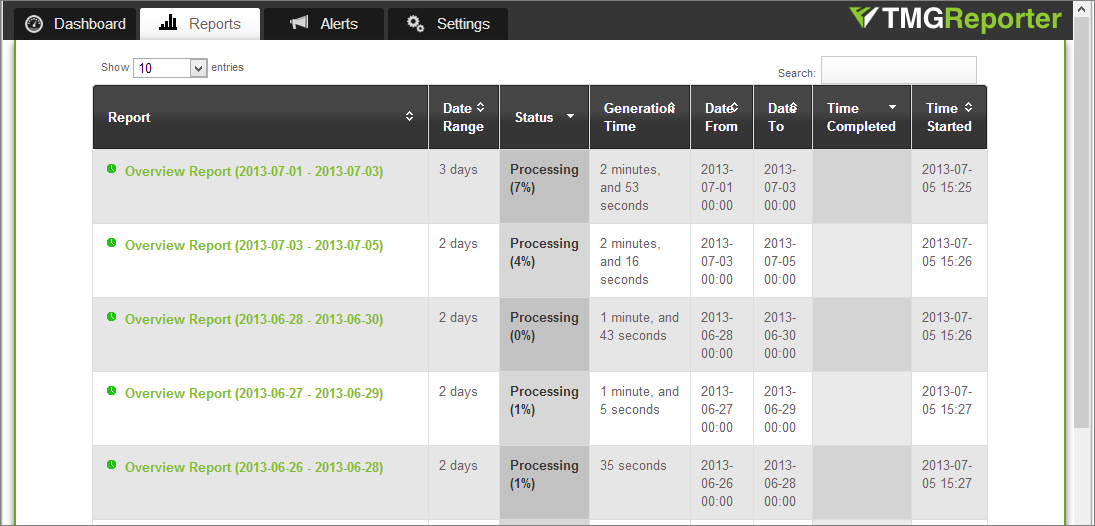
Fastvue Reporter has some enhancements when it comes to processing multiple reports, with particular benefits to IT and Network Security teams. It will now schedule multiple report jobs sequentially based on the number of processor cores available to the server.
So what is the best way to plan, allocate and monitor CPU resources in your Hyper-V environment?
From Release Notes (TMG Reporter 2.0.1.5)
- Scheduled reports are now processed sequentially instead of concurrently. For every three CPU cores available beyond an initial three cores, an extra report can be run concurrently. (e.g. 12 core system can run 4 reports concurrently).
- These changes are to prevent a large number of scheduled reports from maxing out system resources.
Understanding Hyper-V CPU Usage
When running virtual servers in Hyper-V, there is often some confusion when determining how much CPU is actually being used. The typical first approach is to log into the Hyper-V host and open up task manager. Here most people are surprised to see that their CPU usage is minimal, this despite the indication that the VM’s CPU’s are 100% utilized.
Truly understanding Hyper-V virtual and physical CPU usage first requires us to dive into a little bit of theory.
Virtual CPU’s can be allocated to a virtual machine. The amount of virtual processors available are determined by the number of cores available on the hardware. So as an example, if you have a 4 socket server where each processor has 8 cores, this will present 32 logical processors. As a result you will be able to allocate a maximum of 32 virtual CPUs to a virtual server. Each virtual CPU maps down to a physical core.
Configuring Your Virtual Machine's Processors
To understand how this all maps together, let’s have a look at the Hyper-V VM processor configuration. Before we start allocating CPU's, let consider the available resource controls and how they may effect not just this VM, but also the host and other VMs.

Number of virtual processors This is the amount of cores that the virtual machine can see and use. The maximum number that can be specified is the maximum number of cores on the hardware
Virtual machine reserve (percentage) This is a reserve that the host will keep for this virtual machine. This is a percentage of the amount of allocated system CPU so 10% here would be 10% of all 16 cores. In short it is a lot.
Percentage of total system resources This is a calculated value and it takes the number of allocated CPUs. Total system CPU / Allocated CPU * Reserve. Is this case 16 / 32 * 10 = 5%
Virtual machine Limit (percentage) This indicates what percentage of every core the VM can consume. This limit or cap is across all the allocated CPUs.
Percentage of total system resources This is a calculated value based on the amount of allocated CPUs and the maximum limit set. Total System CPU / Allocated CPU * Limit. In this case 16 / 32 * 90 % = 45%
Relative weight This value is used by the processor scheduler to determine which virtual machine gets preference for CPU calls. A VM with a higher weight would get more CPU time than a similar spec VM with a lower weight. This is a deceiving number since it is not a percentage and the values have to be between 0 and 10 000.
Now that we have allocated the virtual CPU we need to see how they behave and how they impact the host.
Monitoring CPU Usage
The simplest way to monitor CPU usage to look at Hyper-V management console. The CPU usage column is representative of the host’s total CPU resources. Seeing 10% usage here would equate to 10% across 32 CPUs, or if we work it back to the amount of resources allocated to the VM it would be 20 % across the 16 VCPUs

They Hyper-V management console is great for getting a high level overview. But to dive a little deeper and see which cores are being used and by what process, we will have to break out Perfmon.
NOTE: When you start Perfmon, the default counter is %Processor Time. As mentioned earlier, this is deceptive as one would think it is for the host’s hardware, but it is in actual fact the usage for the host’s operating system. This is why there is often very low usage here but high total CPU usage.
Monitoring Physical CPUs
The counter you want to look for is Hyper-V Hypervisor Logical Processor. Specifically % Total Run Time. I have added all the instances of the CPU’s so you can see that there are 32 cores all using different percentages and an overall much lower _Total

Monitoring Virtual CPUs
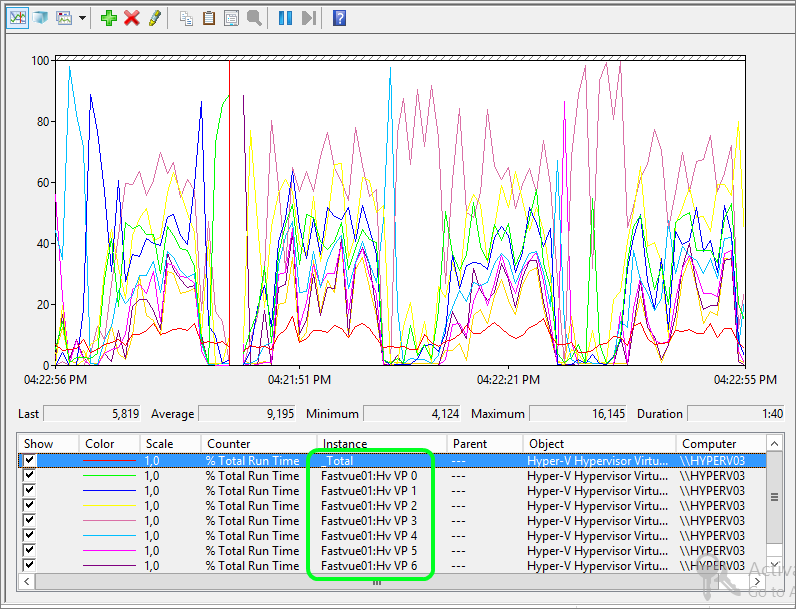
A very useful counter is Hyper-V Hypervisor Virtual Processor. Specifically % Total Run Time. When you select this counter you will notice that it lists the virtual machines VPU’s. Each virtual processor here maps to a logical processor as seen above.

This allows us to see if there is a process running on the VM that might not be threading efficiently and spiking a single CPU core to 100% while the remainder stays low. In Fastvue Reporter's case you will not see this bad behavior since it multi-threads rather nicely. The graph below shows a good spread across the CPUs.
Did you know: Fastvue Reporter produces clean, simple, web usage reports using data from your firewall that you can confidently send to department managers and HR team.
You may have noticed your total virtual CPU’s can exceed the number of physical CPU’s. This is where the weighting and reservation comes into play. A virtual CPU does map to a physical core, but you most likely will have multiple virtual CPUs tied to a physical core. This over subscription is one of the main benefits but also potential problem areas for virtualization.
Planning your Virtual Servers
If you look at the host summary from System Center Virtual Machine Manager 2012 SP1 (VMM) you can see that there are more virtual processors allocated than there are physical cores. You would imagine that this over subscription can cause really high CPU congestion. This may be true in acute cases where there are short periods where the CPU's are all maxed, but this is not the only consideration.

The one major benefit from virtualization is that CPUs can be used when needed and shared when not needed. If you look at the CPU usage for the same server over the duration of an entire month, you will notice that the overall physical CPU usage is actually fairly low.

By using the various counters available in the Hyper-V Hypervisor Logical Processor, and Hyper-V Hypervisor Virtual Processor, categories you can get a very in-depth look into how your host and VM’s utilize the available CPU resources. If you combine this with a knowledge of the various virtual machines and when you expect peak CPU usage times, you can combine or host multiple virtual servers efficiently, enabling good CPU performance when needed.
Take the pain out of reporting on Web Usage and Network Traffic.
Fastvue Reporter produces clean, simple, web usage reports using data from your firewall that you can confidently send to department managers and HR team. Automate reports and get the job of reporting on web usage off your desk and into the hands of people that need it.
There are also a number of benefits to IT and network security teams with the Fastvue Reporter interface helping to reduce IT workload whilst getting a handle on your network and troubleshooting with ease. Download the 30 day free trial today!
Take Fastvue Reporter for a test drive
Download our FREE 14-day trial, or schedule a demo and we'll show you how it works.
- Share this storyfacebooktwitterlinkedIn
Understanding Hyper-V Dynamic Memory (Dynamic RAM)
How to Build a Sophos UTM High Availability (HA) Cluster in Hyper-V