Using Sophos XG Packet Capture To Troubleshoot Connectivity Issues
by


Etienne Liebetrau
Sophos XG has the ability to capture and display actual network packet information right from the management web interface. This is a great tool to determine what is actually happening "on the wire". Unlike firewall logs that can be turned off or configured to exclude logging of some traffic, a packet capture literally shows you every packet that the firewall has to process. Let's have a look at how to enable Sophos XG packet capture.
In this example, I will show you how to determine if Sophos XG is sending syslog messages to Fastvue Sophos Reporter. This is a handy troubleshooting step if you're not seeing any data flowing into Fastvue Sophos Reporter (for other troubleshooting steps, please see our support article).
Starting the Sophos XG Packet Capture
- Go to Monitor & Analyze | Diagnostics | Packet Capture.
- Click the Configure button to limit which packets to capture.
- Set the Number Of Bytes To Capture (Per Packet) to 1024.
- Wrap Capture Buffer Once Full allows refreshing the buffer with new information, purging the older information.
- For the BPF string, specify "host" followed by the IP address of your Fastvue Sophos Reporter server. Click Save.
- Click the toggle switch to start the packet capture.
After a few second click Refresh to see if any results are shown. If a number of packets have been collected you can toggle the switch to stop the capture.

Filtering the Sophos XG Packet Capture Results
Previously we specified the IP address of the Fastvue server as a capture filter. We did this to only capture packets to and from that device. From the image below you can see that a packet capture shows a lot more detail than a log entry would. You can see both in and outbound request for the web browsing on port 80.
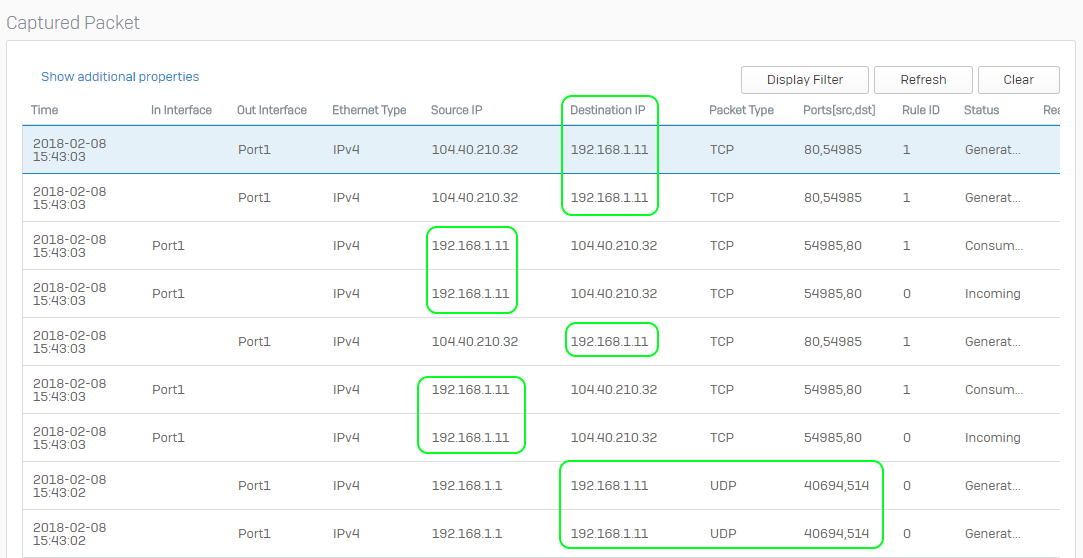
In our case, we only want to see traffic where the Fastvue server is the destination, and we only want to see syslog traffic on Port 514. To filter the view:
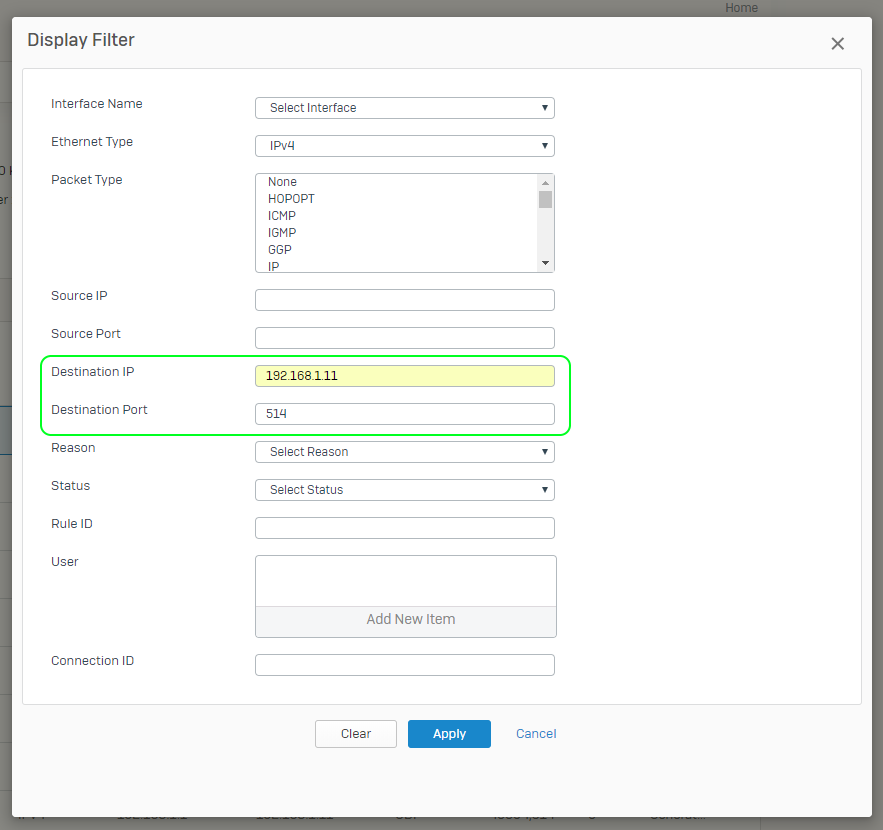
- Click the Display Filter button
- Specify the Fastvue Server as the Destination IP address
- Specify the desired Destination port number. In this case 514 (the default Syslog port).
- Click Apply
Note: Since the traffic we are looking for is UDP, we do not expect any return or ACK messages. If we were looking for TCP traffic, we would expect to see those like we did in the TCP Port 80 example. With UDP, you know that a packet was sent but there is no way to know if it arrived without checking the destination.
Reviewing Sophos XG Packet Capture Results
We've seen that there are packets flowing from the XG device to the Fastvue server on UDP Port 514. So it looks like syslog messages are correctly being sent. We can take it a step further and confirm that the messages themselves are legitimate syslog records.
By looking at the Packet Information you can see that it does look like a legitimate syslog message.
Looking the HEX & ASCII Detail you can see content that looks like it is part of the web traffic log.
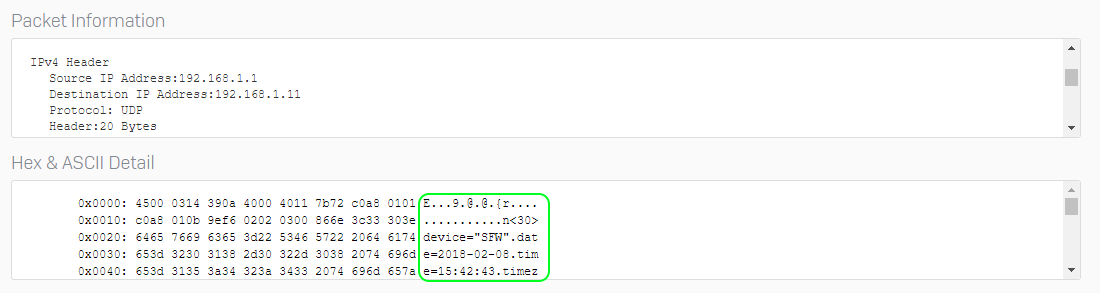
The ASCII portion of this packet - once normalized looks like this:
<30>device="SFW".date=2018-02-08.time=15:06:23.timezone="SAST".device_name="SFVH".device_id=C01001FTWG73X1E.log_id=010101600001.log_type="Firewall".log_component="Firewall.Rule" .log_subtype="Allowed".status="Allow".priority=Information.duration=72.fw_rule_id=1.policy_type=1.user_name="".user_gp="".iap=5.ips_policy_id=1.appfilter_policy_id=5 .application="".application_risk=0.application_technology="".application_category="".in_interface="Port1".out_interface="".src_mac=00:.0:00:.0:00:.0.src_ip=192.168.1.11 .src_country_code=R1.dst_ip=23.23.158.118.dst_country_code=USA.protocol="TCP".src_port=54786.dst_port=80.sent_pkts=4..recv_pkts=2.sent_bytes=184.recv_bytes=92 .tran_src_ip=.tran_src_port=0.tran_dst_ip=192.168.1.1.tran_dst_port=8080.srczonetype="LAN".srczone="LAN".dstzonetype="WAN".dstzone="WAN".dir_disp="". connevent="Stop".connid="982124576".vconnid="".hb_health="No.Heartbeat".message="".appresolvedby="S
This is a syslog message containing a firewall log entry event. At this point in time, we know what the Sophos XG is generating syslog packets and sending them to the Fastvue server.
Conclusion
Sophos XG's packet capture feature is a very useful tool when it comes troubleshooting connectivity issues. It provides a deeper level of information compared to looking at firewall log files. This is especially true in cases such as the one above, where there are no explicit traffic rules defined and limited visibility in the UI for the syslog traffic.
This article was focused on troubleshooting syslog traffic being sent from Sophos XG to the Fastvue Sophos Reporter server, but these same principles can be applied in other troubleshooting scenarios too.
Take Fastvue Reporter for a test drive
Download our FREE 14-day trial, or schedule a demo and we'll show you how it works.
- Share this storyfacebooktwitterlinkedIn
How Digital Monitoring for Schools Helps Protect Students Online (2025 Update)
How to Enable Dark Mode in Fortinet FortiGate (FortiOS 7.0)