How to Accurately Monitor and Improve Sophos UTM CPU Performance
by


Etienne Liebetrau
As Sophos UTM is a full layer 7 firewall, it does a lot more than simply allow or drop traffic based on the source or destination like a traditional 'layer 4' firewall.
Sophos UTM evaluates full HTTP GET requests, determines if the user or subnet has access, if the site is restricted or not, if it contains malware, if the reputation recently dropped, and it can even do HTTPS inspection on the traffic. It makes decisions based on multiple factors, all while maintaining VPN connections, filtering spam, securing web applications, and performing many other roles.
As you can imagine, it takes some serious processing power to do all of this this at scale.
If you are using a virtual appliance and your CPU comes under pressure, you could simply add more CPUs or reduce the CPU demand from other systems on the host. But if you are using a hardware device, managing resource usage is a little more challenging. For this reason, Sophos UTM CPU performance monitoring becomes a critical component in managing your Sophos UTM investment.
This article provides some tips on how gain accurate real-time visibility into Sophos UTM's resource usage, and how to reduce the CPU usage of Sophos UTM's web protection feature.
Sophos UTM's Resource Usage Graphs
Over time, your configuration can gain complexity as you use the UTM in different ways. This in turn can lead to inefficient Web protection rules that can unnecessarily use CPU resources. Once your UTM starts hitting CPU congestion, things start to go downhill. The UTM may start to behave erratically and users could experience proxy connection delays and rejection errors. The problem is that simply looking at the UTM management console won't tell you what is happening.
The Resource Usage widget on the Dashboard has indicators for CPU, RAM and Disk. The problem is that the CPU indicator is averaged and only updates as frequently as you set the dashboard refresh interval.

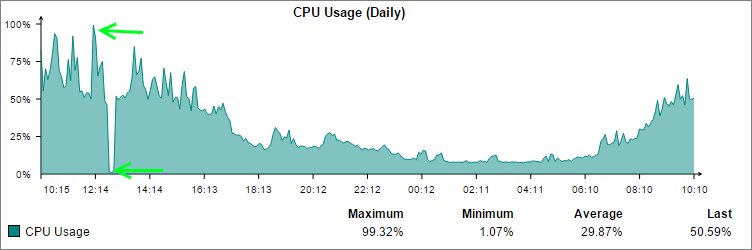
The other method of tracking CPU utilization on the UTM is by looking at the hardware log. Again, it can be useful to give you an overall view, but it won't help you identify sporadic peaks that could be causing issues. As with the Resource Usage widget, the graph is averaged out over time, so short bursts get hidden in the noise.
In the graph below you can see a spike. To hit an 'average' load maximum of 99.32% for a single instance, the CPU would have been stuck at (or around) 100% for quite a while. From the graph you can also see a large drop in CPU usage immediately following the spike. In this case, the drop correlates to when the UTM was rebooted, following the errors network users experienced/reported.
Monitoring Sophos UTM's Resource Usage via Shell
To get a real time accurate view of what the CPU is doing on the UTM, you are going to have to hit the shell. First, enable shell access by following these steps:
- Browse to Management | System Settings |Shell Access
- Toggle the switch to enable shell access
- Set a Password for loginuser and click Set Specified Passwords
- Use a SSH terminal like Putty to connect to the UTM
- Log in with the username: loginuser
The application we are going to use is called top. It is a Linux / Unix tool that shows you the processes and system resources, much like Windows Task Manger. When you run top for the first time you are presented with the screen below. All the useful info is in there, but it may require a little explaining.

There are a number of CPU counters, but the labels aren't very helpful. For your convenience here's a more detailed explanation:
- us: user CPU time (or) % CPU time spent in user space
- sy: system CPU time (or) % CPU time spent in kernel space
- ni: user nice CPU time (or) % CPU time spent on low priority processes
- id: idle CPU time (or) % CPU time spent idle
- wa: io wait CPU time (or) % CPU time spent in wait (on disk)
- hi: hardware IRQ (or) % CPU time spent servicing/handling hardware interrupts
- si: software IRQ (or) % CPU time spent servicing/handling software interrupts
- st: steal time (or) % CPU time in involuntary wait by virtual CPU while hypervisor is servicing another processor (or) % CPU time stolen from a virtual machine
You might also notice that we have a single process that is consuming 298% of the CPU?! The simple explanation is that we are looking at a multi-core system using multi-threaded processes.
Fortunately you can improve the display to make the resource usage statistics a little easier to read:
- Add some color Press Z (uppercase), and then press w to cycle through the standard colors. Pick one you like and press Enter.
- Change the sort order Change the sort order by pressing O followed by the relevant field normally K or L.
- Change the refresh rate Speed up the refresh rate by pressing d. You can specify as little 0.1 but I found 0.5 to be a good speed.
- Save as default settings Make sure top starts up with these settings next time by pressing W to write your preferences file.

If your UTM is running low on CPU you will notice spikes in the %us field. With the higher refresh rate you may now see short bursts of high usage that could be the root cause of some of your issues.
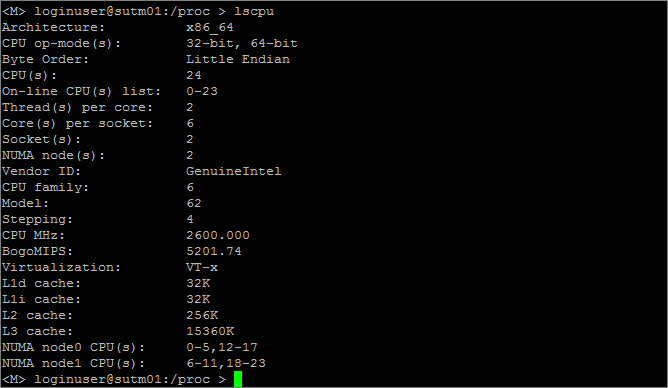
The simplest way to confirm how much CPU you actually have at any given time is by running lscpu:
Common Sophos UTM CPU Hogs
Generally speaking, the highest load will be generated by the http proxy, which usually correlates to settings in the Web Protection module. Key settings that can have a direct impact on CPU usage include single or dual malware engine scanning, HTTPS inspection, and exclusions.
Now that you have an accurate view of what the CPU is doing, you can make changes to the system and watch the effect.
Improving Sophos UTM's Web Protection Performance
I used Fastvue Sophos Reporter's Web Protection dashboard to show which Web Protection policies had the most matched hits. Making changes to the policies that deal with majority of traffic is a great place to start in order to make the largest improvement to CPU usage.

In this particular case the issue was simply the ordering of the filter profiles. I noticed there were Web filter profiles higher up the list than the profile being used by the bulk of the connections. This meant that the traffic was evaluated against multiple profiles before the matching profile was used.
Simply by reorganizing the profiles I was able to significantly reduce the amount of CPU that was required. The system stabilized and has been far more robust from a user browsing perspective.
Checking again the following day I could see that the UTM was running nice and smoothly having lowered the overall CPU usage. So much so that it even showed up on the CPU graph!

Summary
Using the right tools to manage Sophos UTM allows you to extract the most value from it. Sophos UTM's management console is a great interface and Sophos have managed to put a lot of pertinent information in there. However, if you need more real-time or more detailed information, it is great to know you can turn to the shell and Fastvue.
Hopefully this article has provided a few Sophos UTM CPU performance monitoring tips, and shown how the right combination of tools can lead to a faster resolution of any performance issues you might experience on Sophos UTM.
Take Fastvue Reporter for a test drive
Download our FREE 14-day trial, or schedule a demo and we'll show you how it works.
- Share this storyfacebooktwitterlinkedIn
Active Directory SSO Authentication in Transparent Proxy Mode
Deploying Endpoint Protection with Sophos UTM and Enterprise Console