New Version of Fastvue Reporter with Faster Report Times (Beta)
by


Scott Glew
We have been hard at work for the past couple of years, upgrading the data storage and analysis engines in all our Fastvue Reporter applications, improving report generation time. This is the fourth iteration of the Fastvue Reporter platform, and public beta versions of the following Fastvue Reporter applications are now available for testing:
- Reporter for SonicWall v2.0
- Reporter for Sophos UTM and XG v3.0
- Reporter for Barracuda v2.0
- Reporter for Sophos Web Appliance v2.0
- TMG Reporter v4.0
- Reporter for ContentKeeper v2.0
If you are interested in testing it out, here are some things you should know, along with the download and installation details.
1. How fast is the new version?
We have not yet achieved 'instant' report speeds, but we have found the new version to be significantly faster when generating reports. As an example, an Overview Report on 24 million log records that previously took 25 minutes to generate, now completes in just over one minute. And we're not quite done yet! We have some promising ideas on how to improve this even further in the future.
Unfortunately, data import speed is slower than the old version, but it should still be fast enough to cope with the incoming data from large networks.
2. This is a very early build.
We have been privately testing the applications with selected customers for the past few months, but we expect there to be some issues that we haven't encountered yet when installed in other environments. As such, we recommend spinning up a separate server to test on rather than upgrading/overwriting your production Fastvue Reporter installation, or at least taking a backup of your existing server first.
3. Upgrade vs New Install.
With the above point out of the way, you can upgrade your existing installation by simply running the new installer over the top of your existing installation and everything should work. But as we've completely changed the data engine, your existing Fastvue data will need to migrate to the new database. Data migration is done automatically and you can see (and pause/resume) the progress in Settings | Data Storage. This will take some time depending on how much data you have to migrate.
You will only be able to report on new/incoming syslog data and old data that has been migrated.

We would love to get some feedback on the data migration process, so if using a backup/duplicate of your existing Fastvue Reporter VM as your test server is an option, that would be great.
4. Increased Data Storage Requirements
Faster reports have come at a data storage cost. The new data storage engine requires approximately twice the disk space compared with our old/existing data storage format, and that's with compression.
Your data retention policy is specified in Settings | Data Storage | Settings so we recommend adjusting this appropriately. If you are upgrading, do this before or soon after the upgrade to avoid data loss as your old data is migrated.

For example, if your data retention policy is set to 500 GB, and this stores 1 year of data, then the new engine will only be able to store 6 months of data in the same retention policy. If possible, increase the size policy to 1 TB to retain the one year of data. You obviously need to have the disk space available to do this.
4. New Prerequisites.
We are using Elasticsearch as the new data storage and analysis engine, which in turn requires Java, and we have upgraded Fastvue Reporter to run on .Net 4.6.
The Fastvue Reporter installer takes care of all of this for you, but if you are interested in the details:
- The installer will install a self-managed version of Open JDK and Elasticsearch.
- The Java files live in C:\Program Files\Fastvue\
\jre - The Elasticsearch configuration and data lives in Fastvue Reporter's Data Location (shown in Settings | Data Storage | Settings) in the Data.elastic folder (the default data location is C:\ProgramData\Fastvue\
\Data.elastic)
When looking at your server's resource usage in Task Manager, you will now see that the Java process takes a considerable amount of CPU and Memory (by design). This is the process responsible for Fastvue Reporter's database (Elasticsearch).
As the Elasticsearch database and Java instance is completely managed by Fastvue Reporter, restarting the Fastvue Reporter service in services.msc will restart the java instance and the Elasticsearch instance.
5. New Diagnostics
The Settings | Diagnostics page now has three tabs.
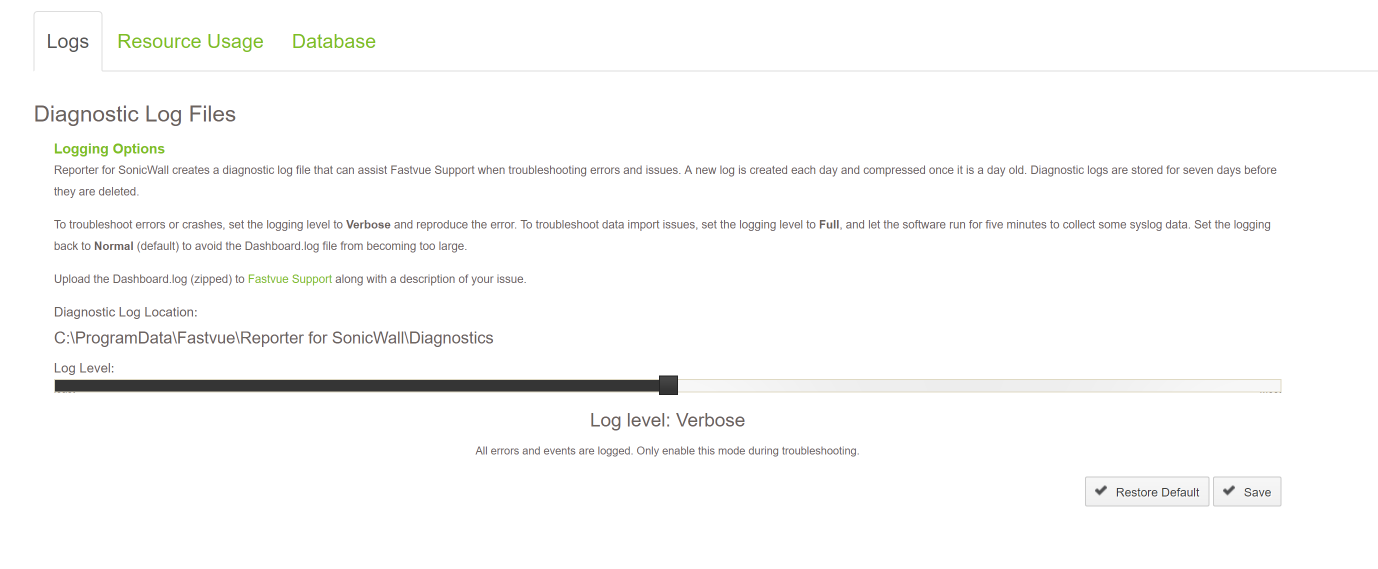
Logs tab
Enables you to switch the diagnostic logging level between Normal, Verbose and Full. This functionality remains unchanged. Diagnostic logs are now stored in the /Diagnostics folder in Fastvue Reporter's data location. New logs are created each day. Old logs are compressed and deleted after seven days.
Resource Usage tab
Charts showing the current CPU, RAM and Disk usage of both the Fastvue Reporter service and the Elasticsearch database.

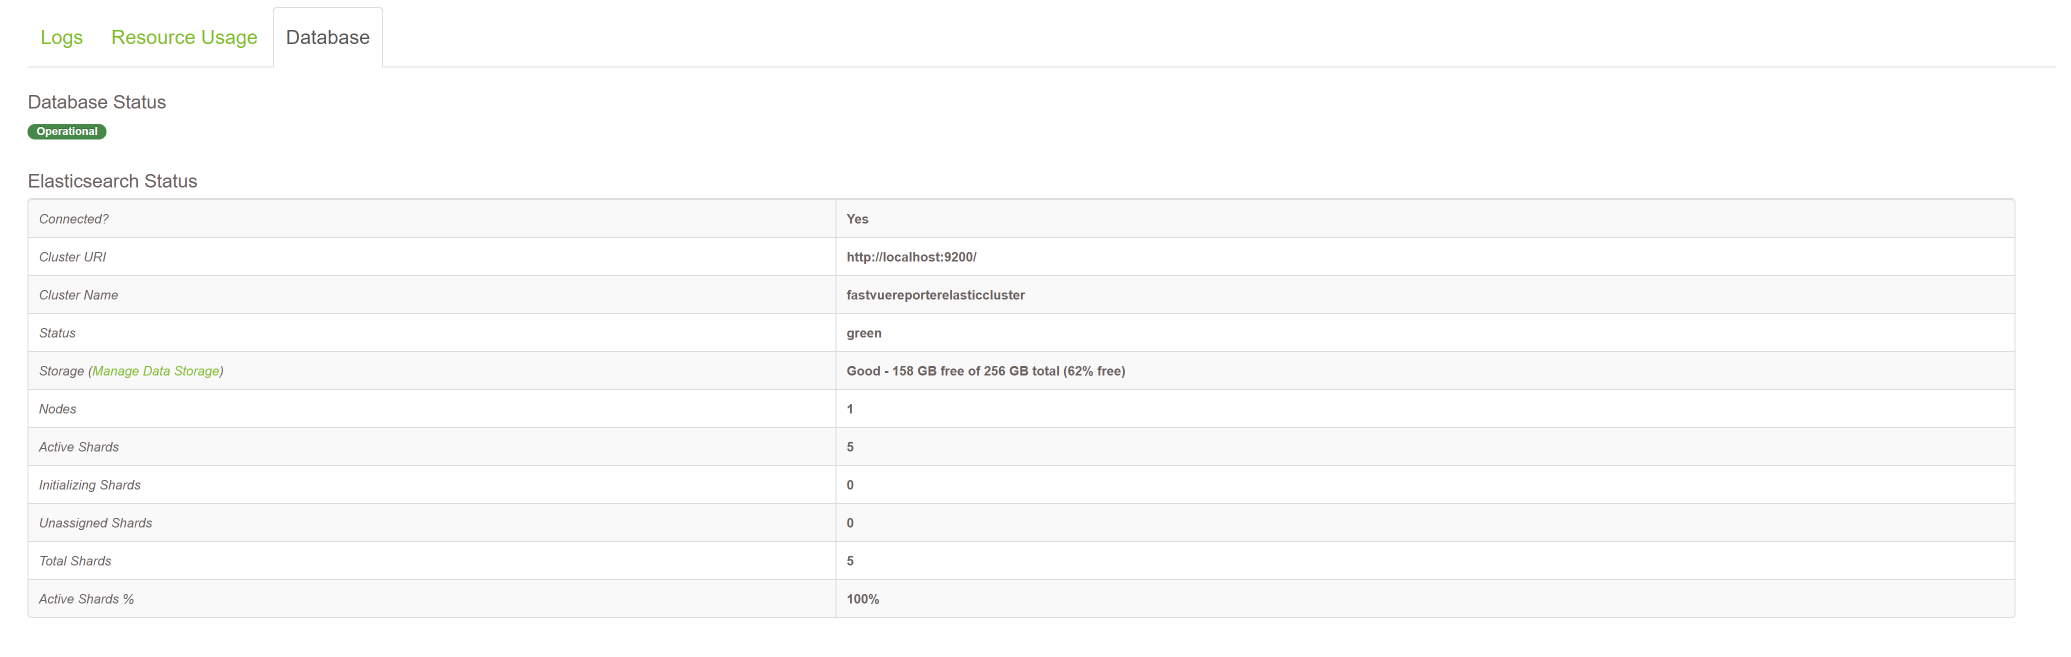
Database tab
Shows the current status of the Elasticsearch instance.
6. Can I use my own Elasticsearch cluster?
By default, Fastvue Reporter installs and manages its own Elasticsearch instance. However, if you are experienced with Elasticsearch and want to make use of its horizontal scaling capabilities etc, you can point Fastvue Reporter at a separate Elasticsearch cluster. Doing this requires a few changes in Fastvue Reporter's settings file, so let us know if you're interested in doing this and we'll send you the details.
7. New Report Types
Fastvue Reporter has always had three main report types. Overview Reports, User Overview Reports and Activity Reports.
The Overview Reports and User Overview Reports contained information on Bandwidth and Productivity along with IT / Network / Firewall information. Many customers use Fastvue Reporter to send Internet Usage reports to HR and Department Managers, and these people are not interested in seeing information about Firewall Policies and IP connections, so we have separated the two "Overview" Reports into Internet Usage and IT Network and Security reports. This means you can simply send the HR team an Internet Usage report, and the IT team the IT Network and Security Report. We also have the All Usage report for those occasions where you want to view everything in one report.

8. Problems?
If you encounter problems with this version, make sure the Database status is 'green' and connected in Settings | Diagnostic | Database. If not, try restarting the Fastvue Reporter service in services.msc
If you find you have to keep restarting the service, or encounter frequent issues, increase the logging level to Verbose in Settings | Diagnostic | Logs, wait for the issue to reproduce, and then upload your diagnostic logs (location also shown in Settings | Diagnostic | Logs) to https://www.fastvue.co/upload
This should provide us with enough information to troubleshoot the issue.
How to Download and Test
Sign up for our Software Testing Program and download the new version.
Full instructions are available after sign up.
We really appreciate your time to test out this new version. If you have any feedback, questions or issues, please email [email protected].
We look forward to hearing from you!
Take Fastvue Reporter for a test drive
Download our FREE 14-day trial, or schedule a demo and we'll show you how it works.
- Share this storyfacebooktwitterlinkedIn
SonicWall Analyzer End of Life and SonicWall Analytics Review
SonicOS 6.2.6.0-20n New CFS and New Logging Bugs